Find CPU-heavy apps
WattBar ranks the top five apps and processes by their share of the CPU energy it observed. Switch time ranges and bring a running app forward directly from its row.
WattBar turns your menu bar into a clear view of the power your Mac is using, the energy your charger is supplying, and the power flowing into or out of your battery. Open it to find busy apps, follow live trends, understand charging, and build a useful local history.
No account, helper, or additional permission prompt required. Readings stay on your Mac.
Start with the live picture, then move from a momentary reading to the apps, trends, and history behind it.
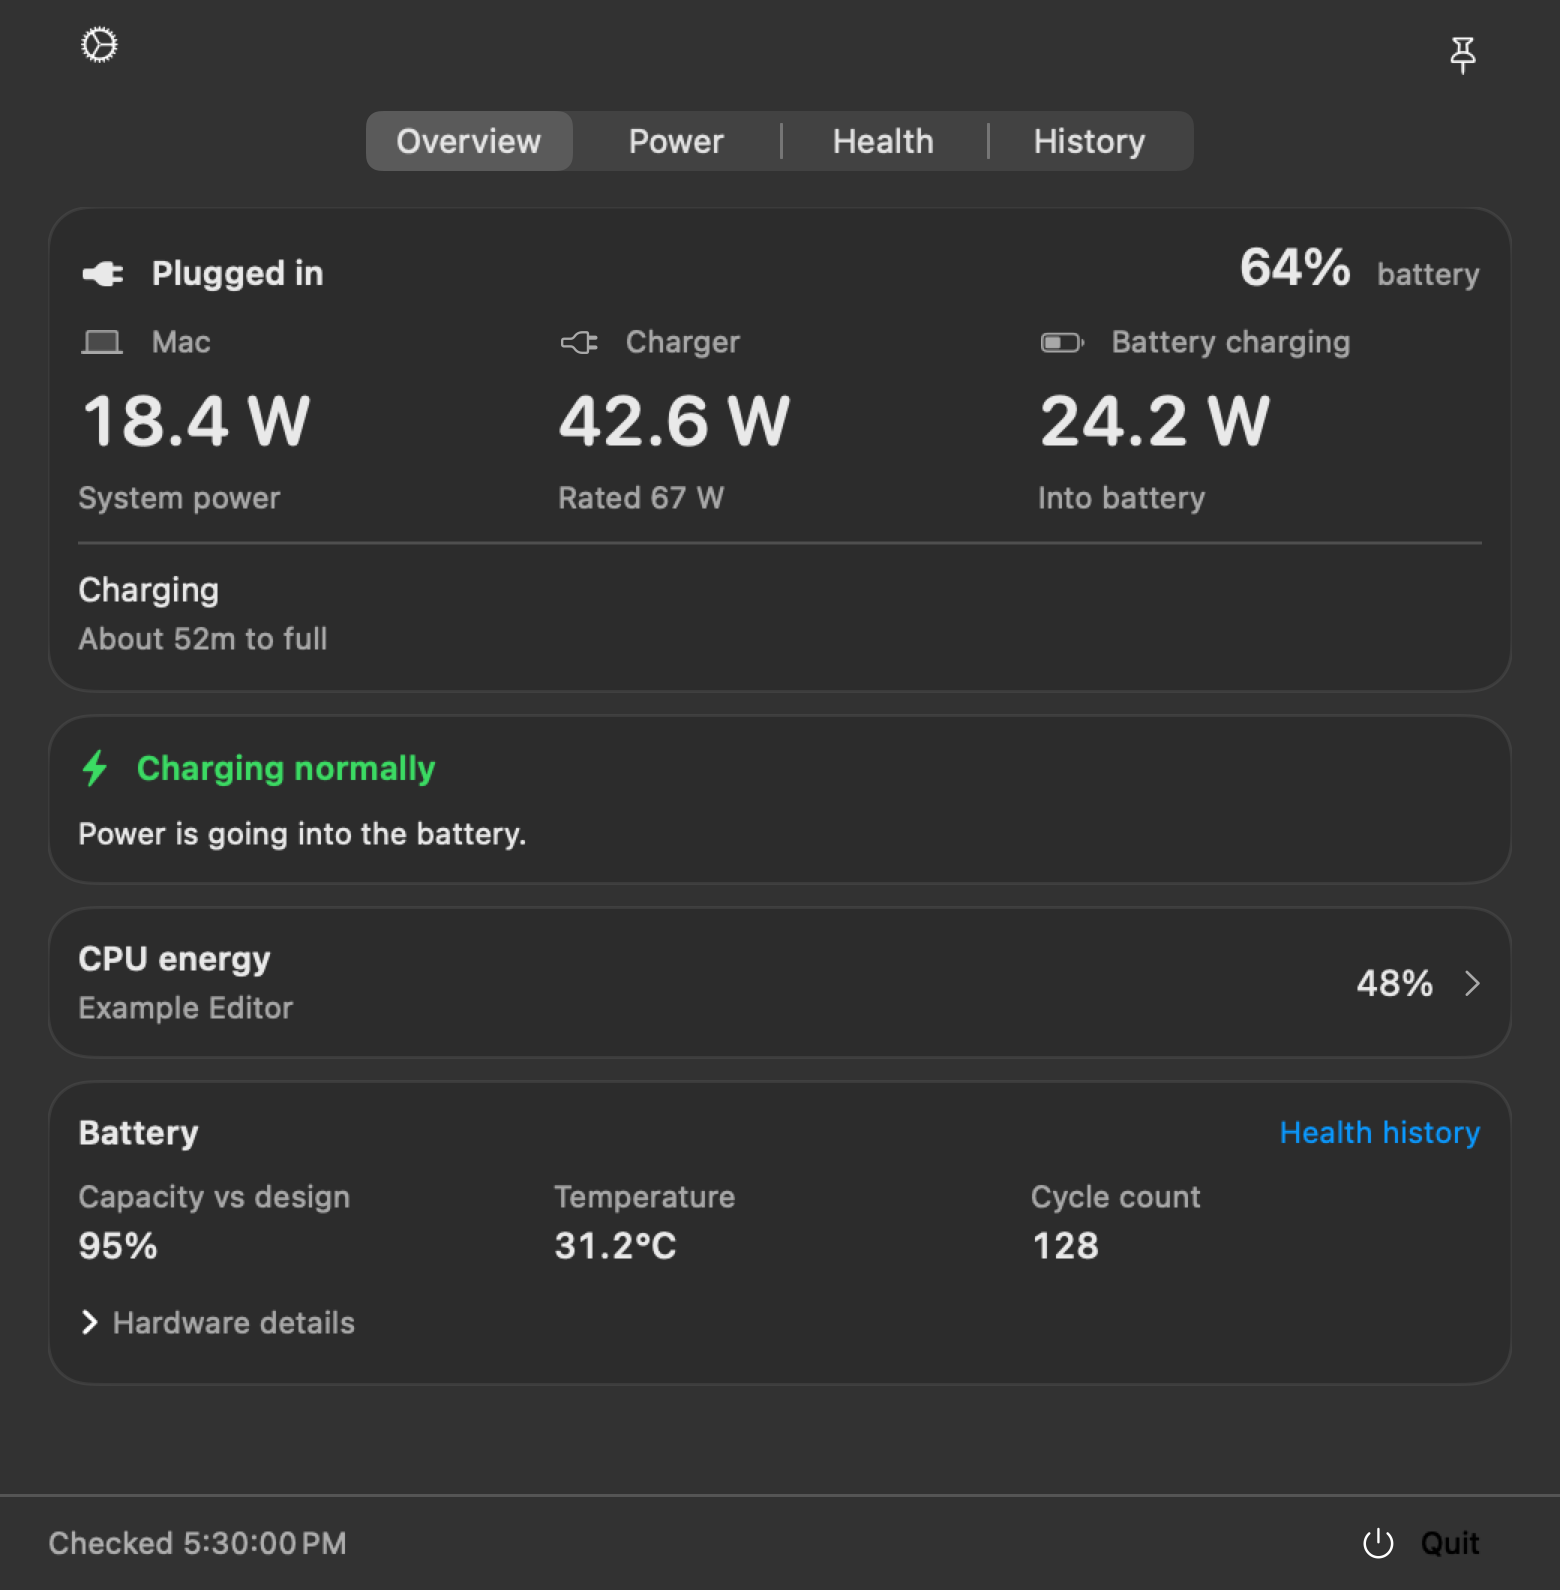
See system power, charger input, battery flow, charging state, and key health readings without leaving the menu bar.
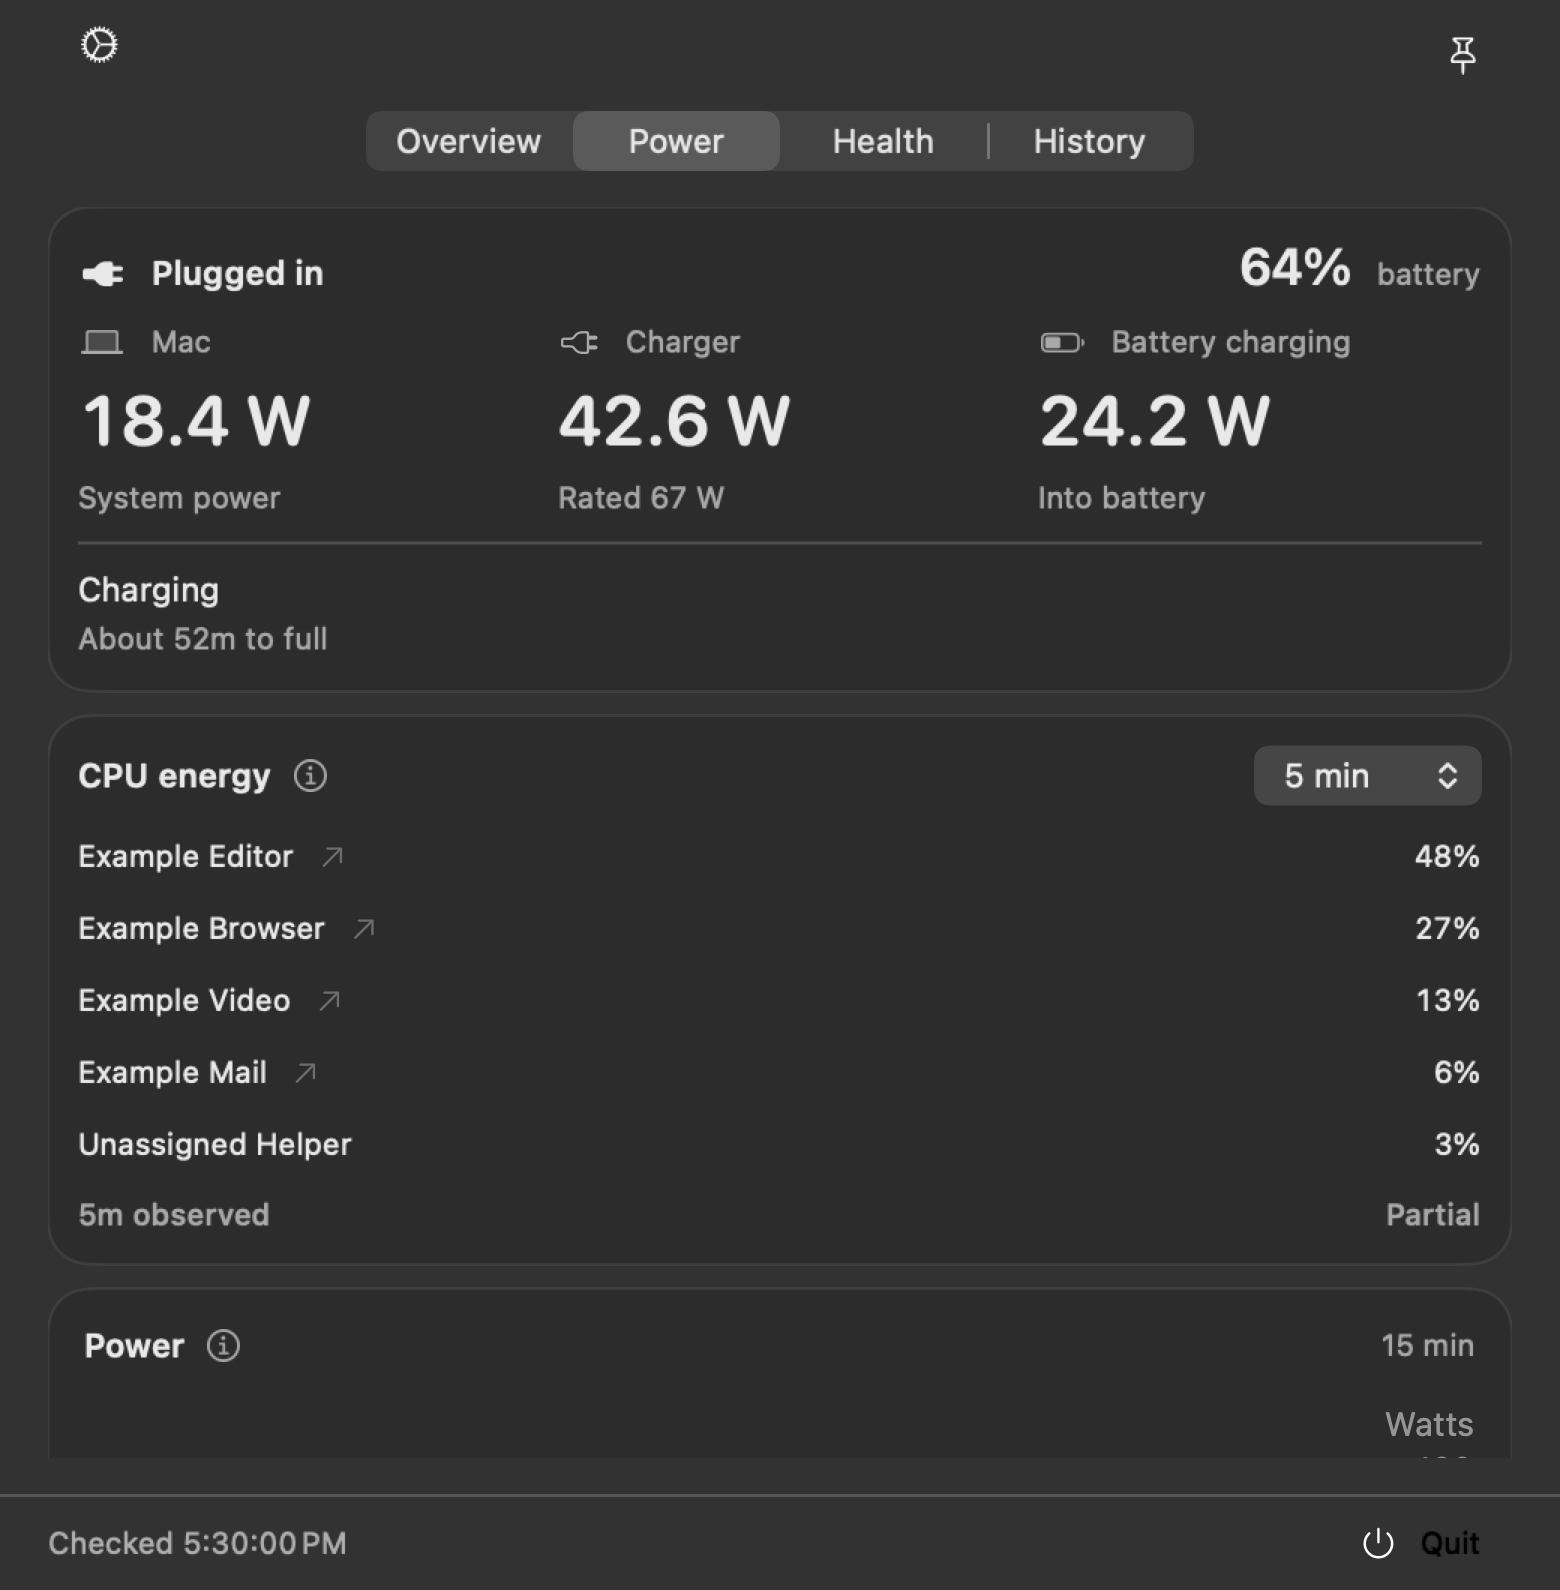
Compare the top apps and processes by observed CPU energy over the last 5, 10, 15, or 30 minutes.
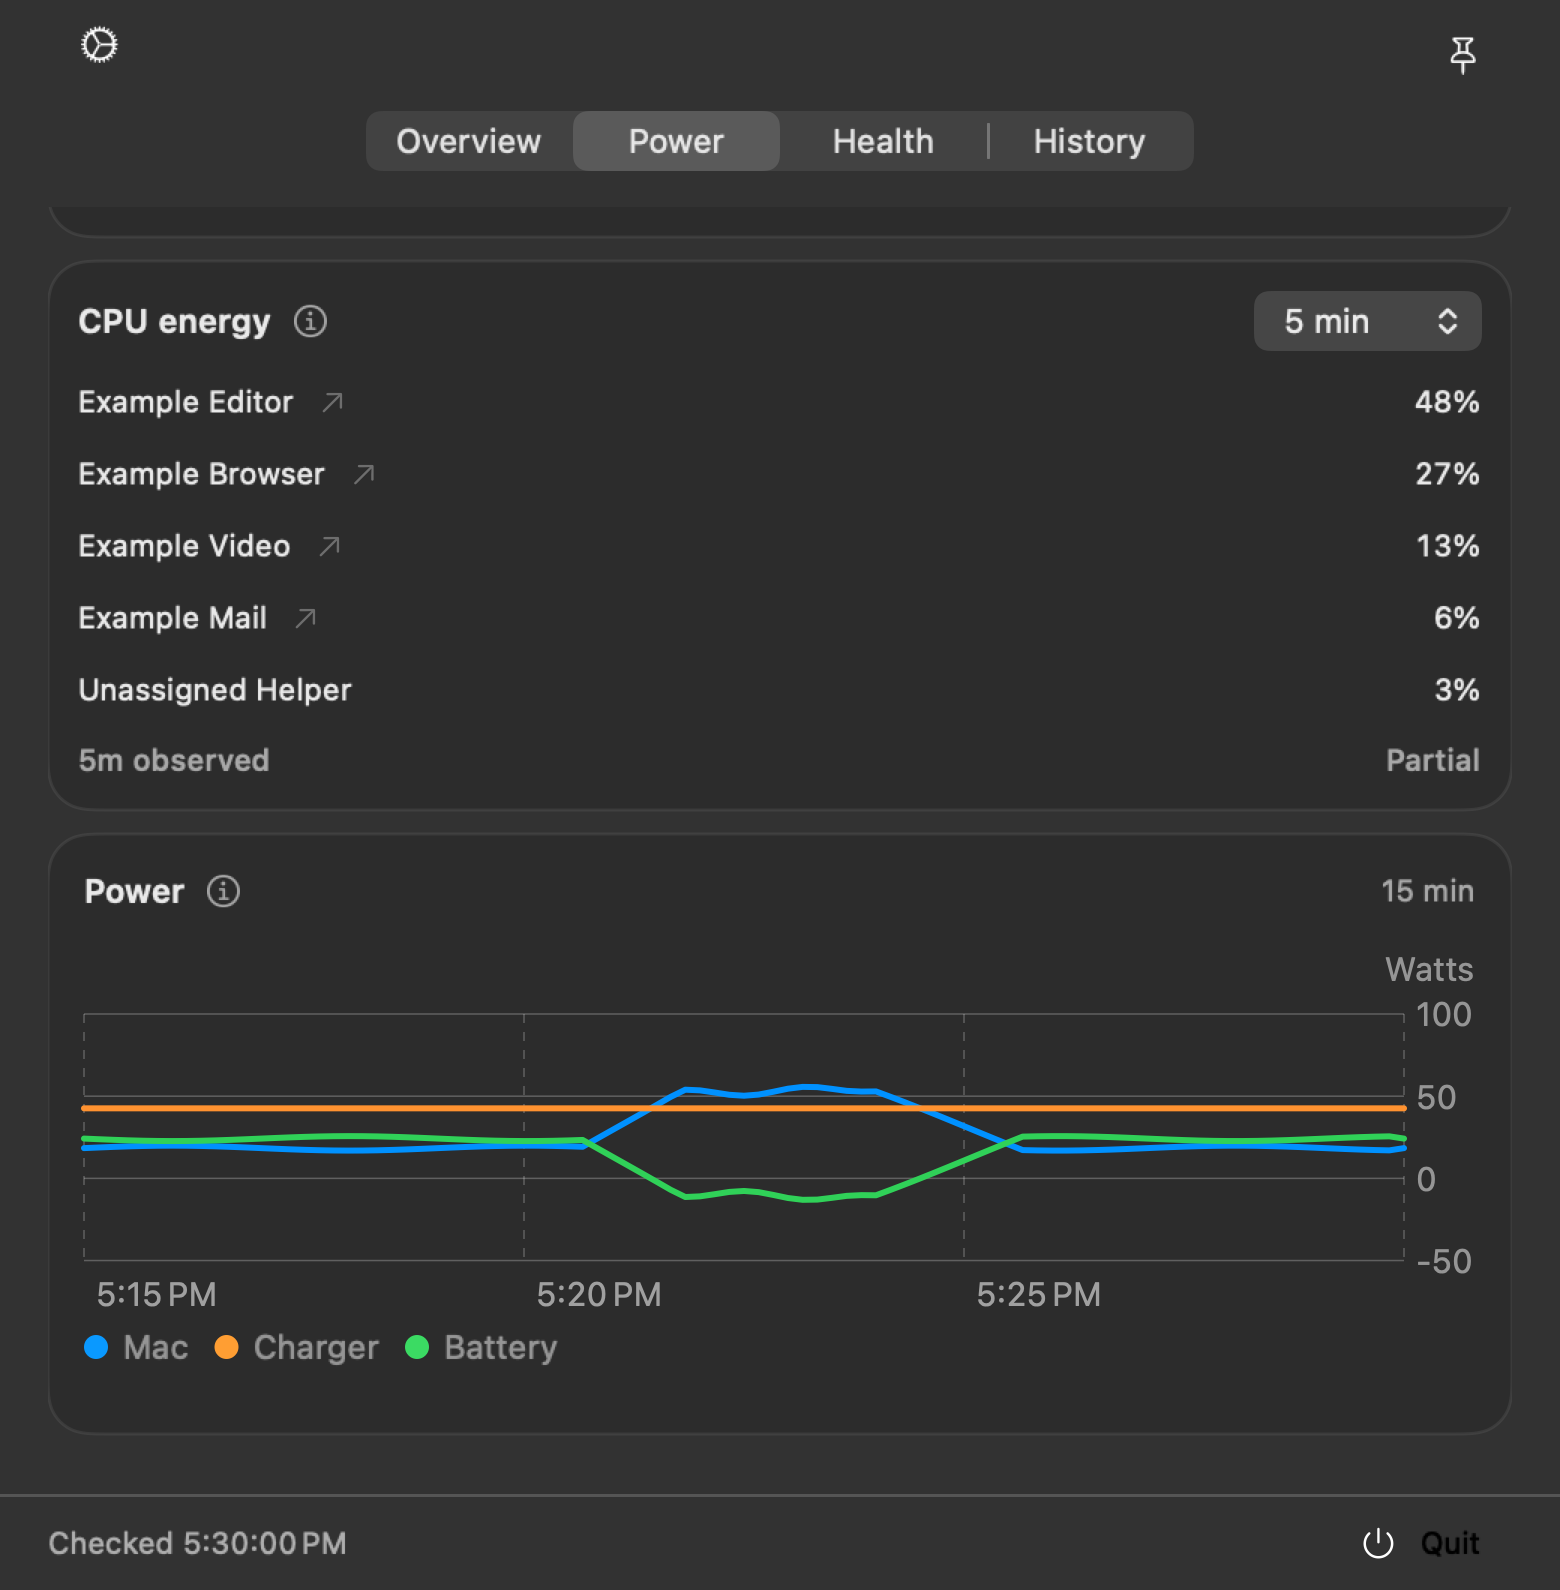
Follow the last 15 minutes of Mac, charger, and signed battery power, with gaps left visible when readings are unavailable.
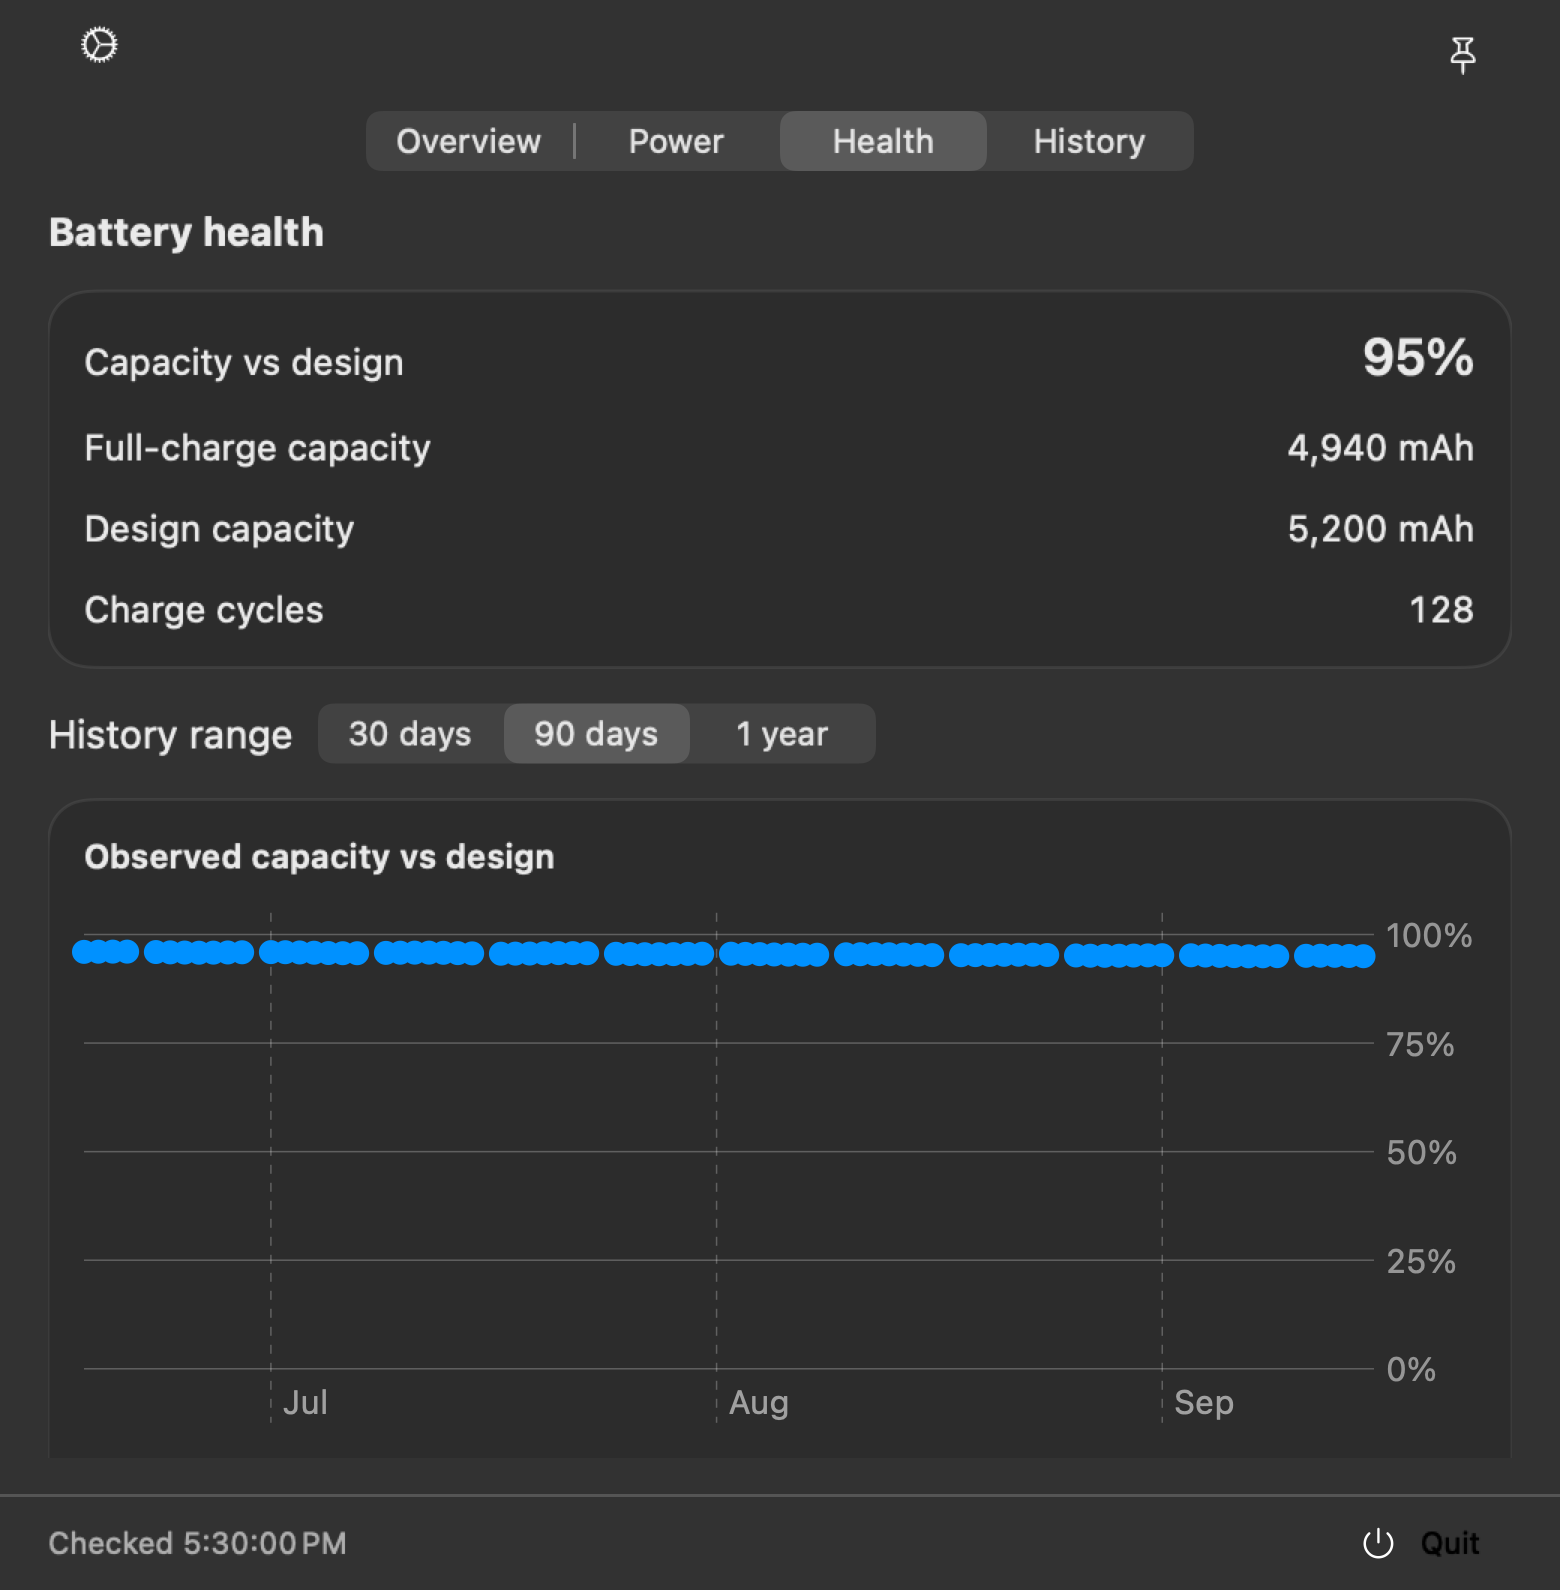
Review capacity versus design, full-charge capacity, cycle count, and daily observations across 30 days, 90 days, or one year.
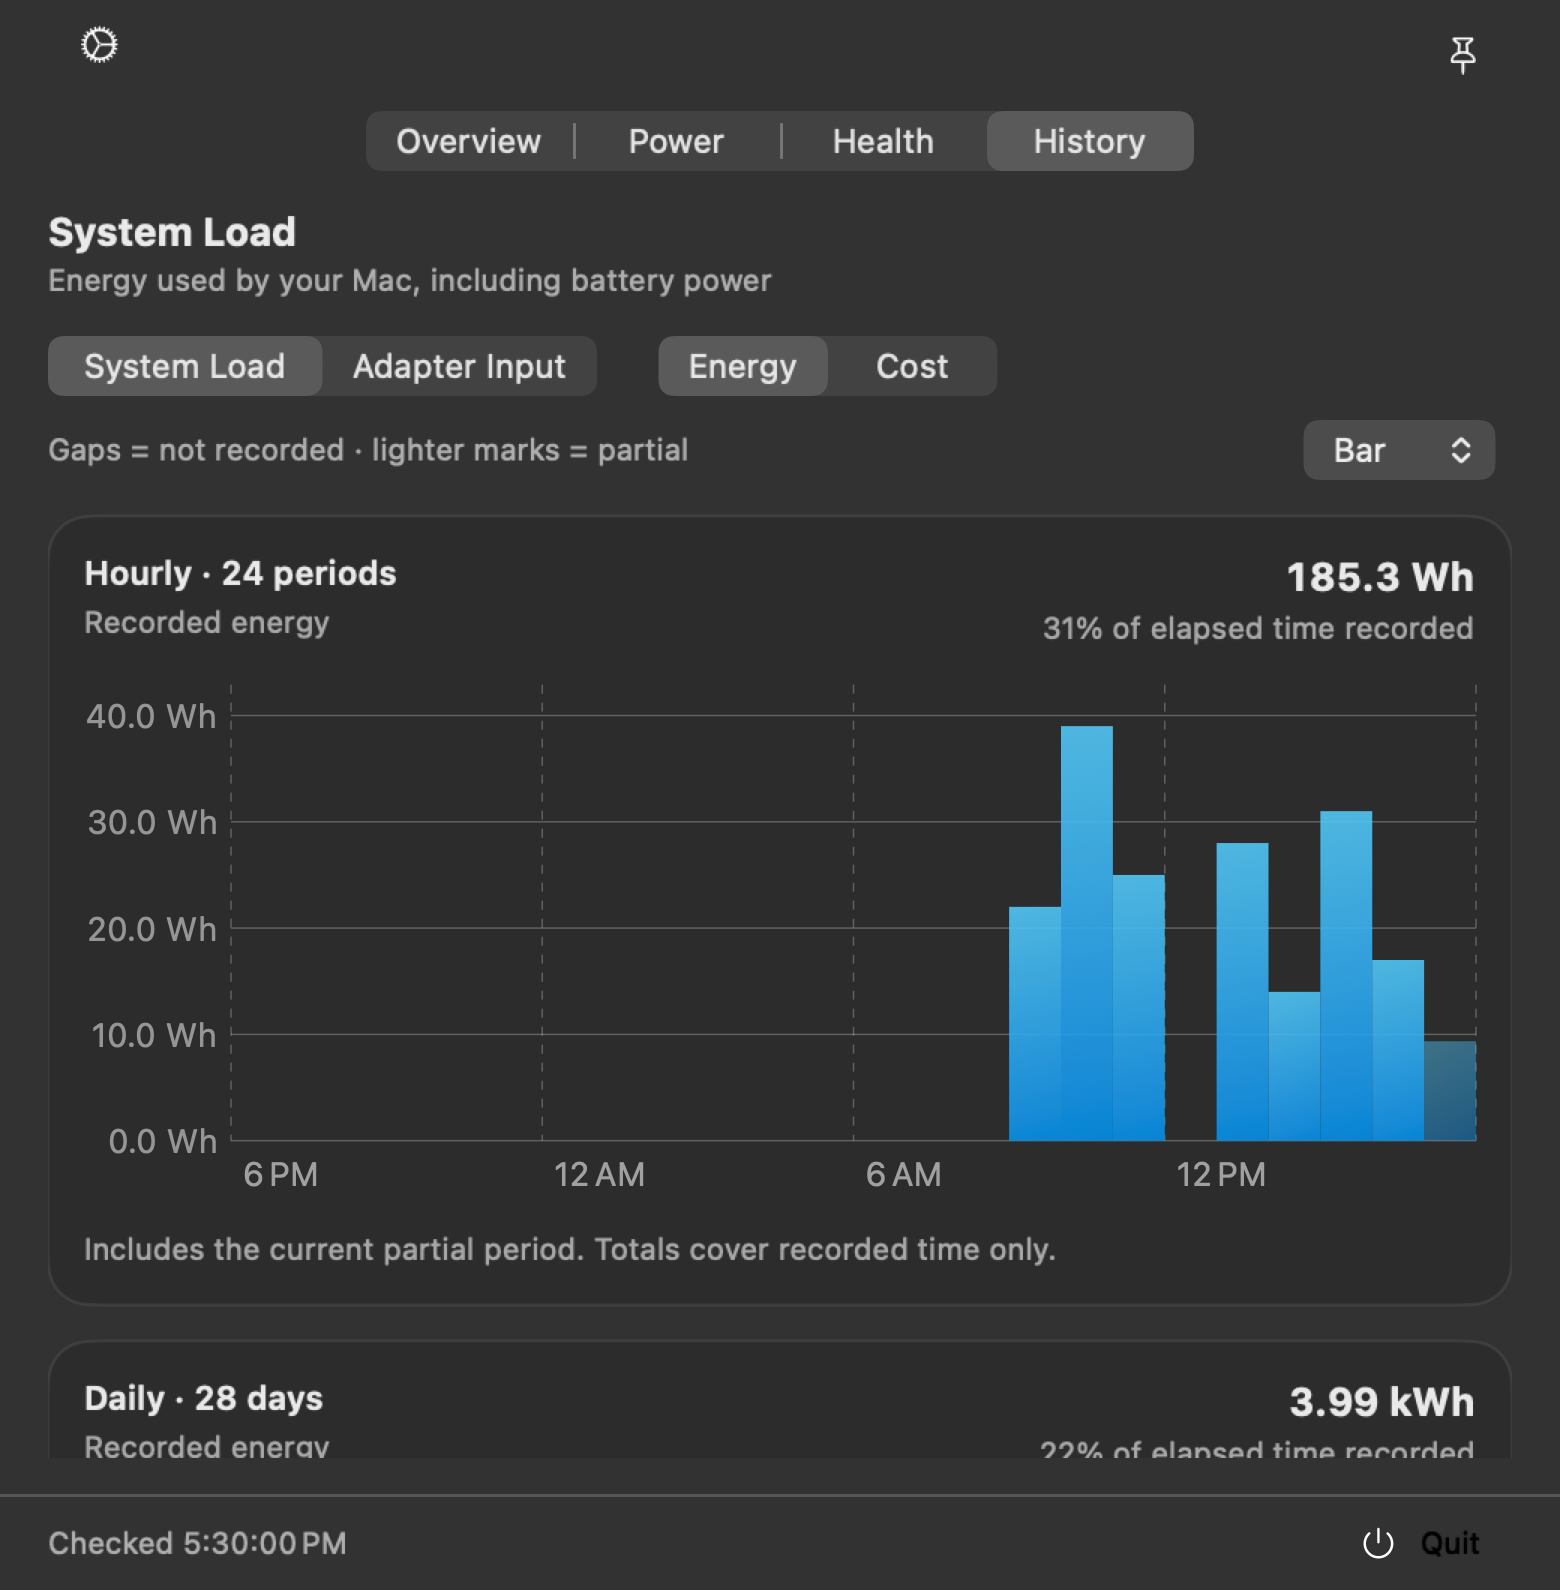
Review hourly energy across the latest 24 periods and daily energy across 28 days, including recording coverage and optional cost estimates.
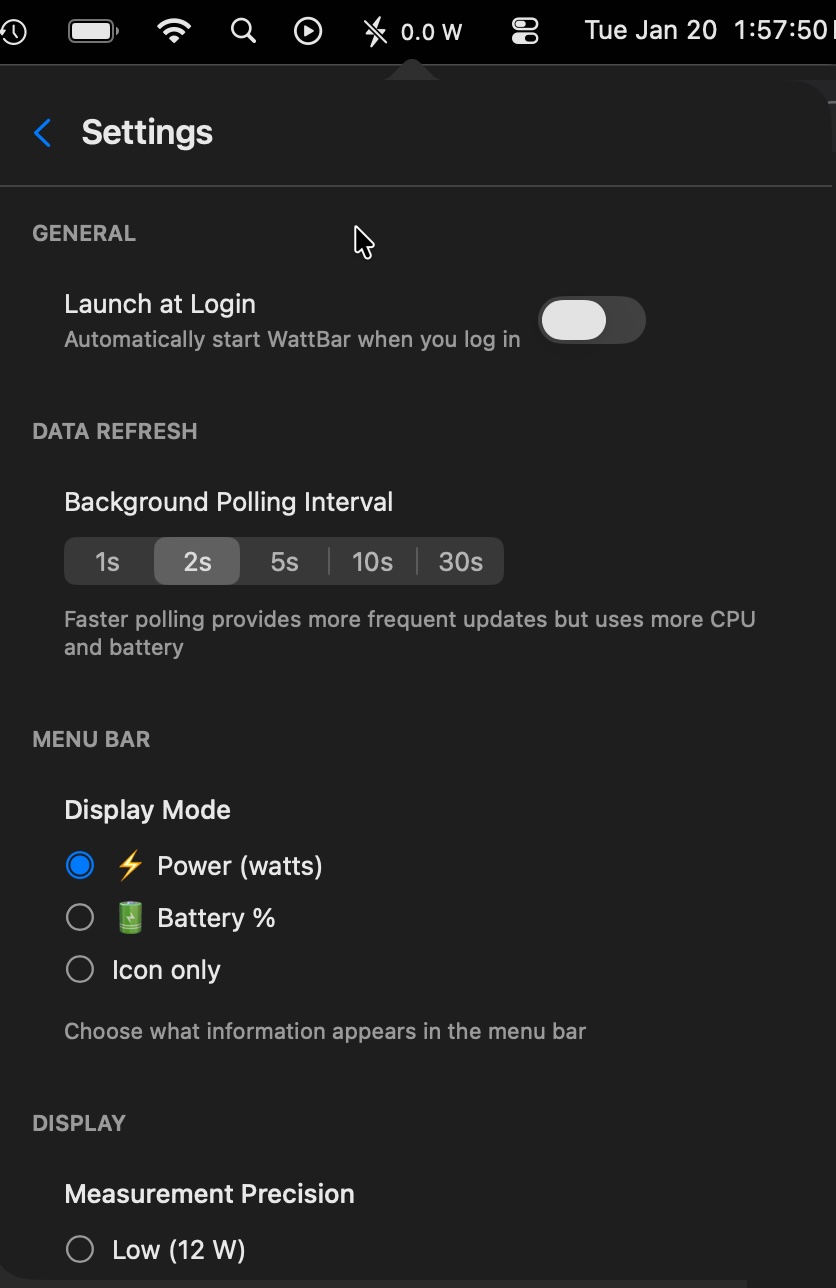
Choose system load, adapter input, battery flow, a split view, battery percentage, or an icon-only menu-bar display.
WattBar ranks the top five apps and processes by their share of the CPU energy it observed. Switch time ranges and bring a running app forward directly from its row.
Compare the power your Mac is using with charger input and battery flow. WattBar also explains supported states such as normal charging, a charge-limit hold, or a battery helping an undersized charger.
Follow observed capacity instead of relying on one reading. Daily health records are kept for up to five years and separated after a confirmed battery replacement.
See recorded energy hour by hour or across 28 days. Add your electricity rate for a local cost estimate based on the energy WattBar recorded.
Overview and Power refresh quickly while visible. WattBar reduces background checks, adapts in Low Power Mode, and pauses collection during system or screen sleep.
Pin the panel while you work, choose what appears in the menu bar, adjust measurement precision, and keep existing custom background-refresh preferences.
Available readings vary by Mac and macOS. WattBar labels missing information as unavailable, leaves unrecorded chart intervals blank, and shows when app-process coverage is partial.
App percentages represent shares of tracked CPU energy only. They do not include GPU, display, or other device energy, and they are not watts or battery-percentage estimates.
Live power traces and recent app activity are kept in memory. Energy and battery-health history build from the readings WattBar records; earlier health data is not reconstructed.
WattBar has no account, analytics, tracking, or cloud synchronization. Power readings, app activity, battery health, history, and cost settings stay inside the app's local sandbox.